Advanced data analysis
Based on an introductory blog article on how to analyse raw data, we now want to examine longterm trends. In this article, we want to identity the environmental factors which contribute most to the weight development inside a beehive. In order to do this, we will use the data by the eHive at the AGES (AUT-BIE-1), since there have been neither technical issues nor human interventions over the course of this summer. We are interested most in the timeframe from end of May to end of July, since this is the time when bees collect most nectar.
For Context: The »bee year« starts and ends with summer solstice, i.e. the calendar beginning of summer on June 21. Until then the bee colony grows, i.e. a lot of bees hatch. After, the queen reduces oviposition and the colony prepares for winter. Additionally, the flowering of most crops is over, and it becomes more difficult for the bees to find food.
Disclaimer: In a highly complex biological system such as a bee colony a lot of different processes can influence the weight development. This article concentrates on only one colony, and makes some exemplary observations based on a few select weather values. This of course doesn’t prove that a statement is valid for most or all bee colonies. Furthermore, found correlations don’t imply causation. Instead, the article is supposed to demonstrate what can be examined from eHive data.
1) Data Download
First, we will download the data from the diagram view on the BeeBIT homepage. As working hypothesis, we assume that the weight development correlates with solar irradiation and exterior temperature.
Why especially these environmental factors? We expect the hive weight to increase when the bees collect most nectar and pollen. This implies to conditions that have to be fulfilled:
- The bees must be able to fly out, so it should be appropriately warm, and there should be neither storm nor rain.
- Plants must provide nectar. This depends on many factors, but basically it should be neither too wet (rain washes the nectar away) nor too hot (nectar dries out).
Therefore, we included the data Hive »weight«, »Exterior Temperature«, »Interior Temperature 3«, »Solar irradiation« and »Exterior humidity« in the dataset.
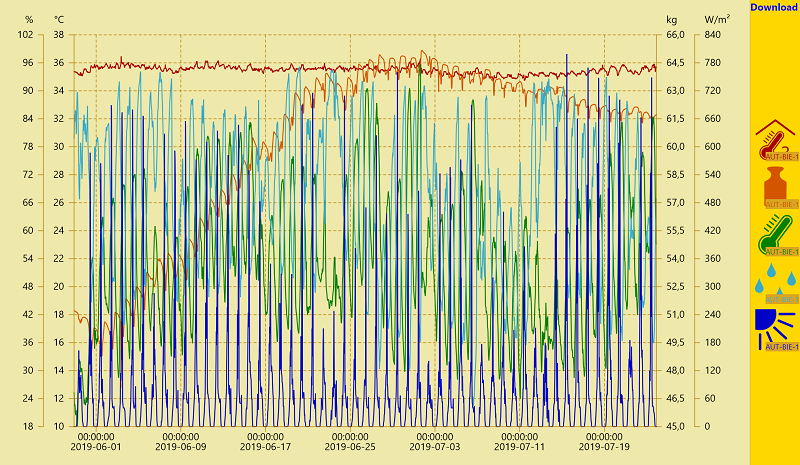
In Fig. 1, we only detect a few general trends: the hive weight increases steadily until end of June and then slowly decreases in July, also the interior temperature is nearly constant at about 35°C. With NumPy we can calculate daily averages of the data. For the weight, we don’t need the average but the difference of two values at midnight, c.f. Fig. 2.

2) Influences on the hive weight, June
Still too chaotic? We will simplify the data even further in a minute. We spot in the first month (before summer solstice), that a high solar irradiation (green curve) correlates with a high increase in hive weight (blue curve), and that the weight increase is rather low (or even negative) on days with low solar irradiation. Later, this correlation appears to become weaker.
Apparently, something changes within the colony, and this possibly has something to do with summer solstice. We now plot all data points of the first 40 days (up to 2019/07/08) in a scatter plot, c.f. Fig. 3. The horizontal position of a day is determined by the weight difference, the vertical position by the solar irradiation. The color indicates the exterior temperature.

The presumed correlation apparently really exists! On days with high solar irradiation, the hive weight increases more than on days with low solar irradiation. We assume that larvae don’t grow faster or slower depending on solar irradiation, so the observed difference probably comes from collected nectar. There are, however, a few outliers, which we will discuss later: days with high solar irradiation where the hive weight decreases (top left corner) and days with low solar irradiation where the hive weight increases (bottom right). These outliers are labeled with their day, so we can find them later.
Also, the weight change appears to be relatively independent from the exterior temperature in June.
3) Influences on the hive weight, July
This changes in July, therefore we exchange the horizontal axis. The color of the points now correlates with solar irradiation, c.f. Fig. 4. The plot contains all days starting from day 25 (June 23).

Apparently, the exterior temperature is the governing factor for weight development after summer solstice. This can be well explained: At the beginning, we saw that the interior temperature remains approximately constant. Consequently, the bees have to actively heat on most days, i.e. consume food – and they do so the most on coldest days. They also consumed food in June, but during days with high solar irradiation they were able to collect more food than they consumed. These two factors appear to govern the weight change. From literature we know that most bees hatch before summer solstice, which contributes to the high difference of the absolute values of weight change in June and July.
4) Outlier
We notice that there are outliers in both scatter plots. Ideally, we can find an explanation for these using the BeeBIT data. As example, we concentrate on the outliers in June.

We still have some weather factors which have not been analyzed yet: Precipitation and air pressure. When we mark the outliers of the first scatter plot, we discover that they often appear near heavy rain, often the day before or after, c.f. Fig. 5. The red points are days where more nectar was collected than on days with comparable solar irradiation, the black crosses are days where less than usual is collected.
For the two black points, we can find a simple explanation: On the day after rain, the flowers are still wet, the bees have difficulty reaching the nectar. Therefore, they are collecting less, even if the sun is shining.
The red points appear either on the days before rain or one or two days after rain. Since the bees appear to target a weight increase of 0.5 kg/day, the work more on days after rain (compensation of lost time). Furthermore, plants might provide more nectar during these days. Also they are more productive on days before rain (which can be anticipated from lower air pressure), see days 7 and 23. The bees appear to factor future weather changes into their schedule, and know that they have to make up leeway after losses during rainy days. I was unable to find this observation in the literature, and it should be evaluated more thoroughly. Unfortunately, there currently are very few other datasets, where there have been neither human interventions nor technical problems nor swarm events during an entire summer (i.e. no sudden jumps in weight). As soon as we’ve developed a working bee counter, this hypothesis could be verified or falsified.
5) Summary
- In the main blooming period in June, the weight increase correlates with solar irradiation and less with temperature.
- In July the weight difference correlates with temperature and less with solar irradiation, since the bees must heat the hive.
- Outliers appear on days before or after rainfall. The bees seem to anticipate the rain and compensate bad days on the following days, even if the weather is not ideal for nectar collection.
Some factors of influence have not been discussed due to insufficient data, i.e.:
- Plants need water to produce nectar.
- We are unable to decouple weight increases due to reproduction and weight increases due to nectar collection.
Supplementary Materials
- this blog article as PDF: analysis2.pdf
- used raw data: data.txt
- Python script: script.py
 DE
DE