A new system for teaching materials
BeeBIT has always relied on the commitment of interested teachers to prepare the data collected by the eHives for teaching in schools. As a handout, we provide a large number of elaborated lessons for free download. The materials cover all science subjects from mathematics to computer science, physics, chemistry, biology and geography. Whether elementary school or high school, suitable questions and difficulty levels can be filtered in our database, viewed, downloaded and then edited if necessary. (All teaching materials are offered as docx files to allow teachers to make adjustments based on the curriculum and students' qualifications).
In addition to the freely available worksheets, there is a protected area on our website that contains suggested solutions and materials specifically intended for teachers, which can only be accessed after registration. BeeBIT checks once whether new users are authorized to access these materials based on their professional background. This prevents crafty students from unauthorizedly downloading the solutions to the worksheets. The system for managing and downloading the lessons has not been further developed since 2016.
The new system
After launching the modernized BeeBIT website in March 2019, the provisional nature of the old system became more and more obvious and the association decided to tackle a modernization. After a long time and several attempts, we can finally announce the launch of the new user interface. You can find it in the navigation menu of the site under the tab 'Didactics'. Besides a more appealing visual design, some new or improved functionalities could be implemented, which will be briefly explained in the following. To conclude this blog post, we would like to give a small insight into the spectrum of available materials. The goal is to motivate readers to discover the materials on their own.
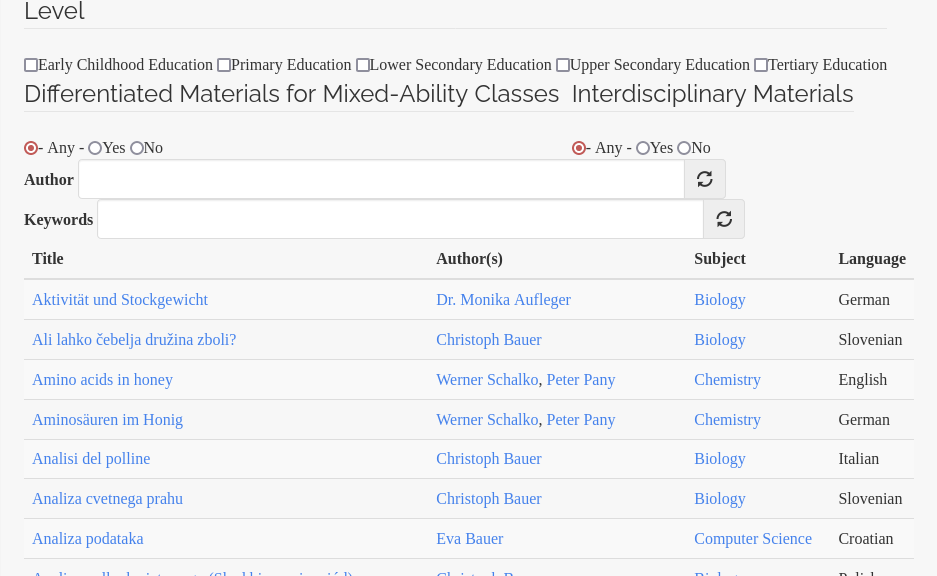
Presentation and Navigation
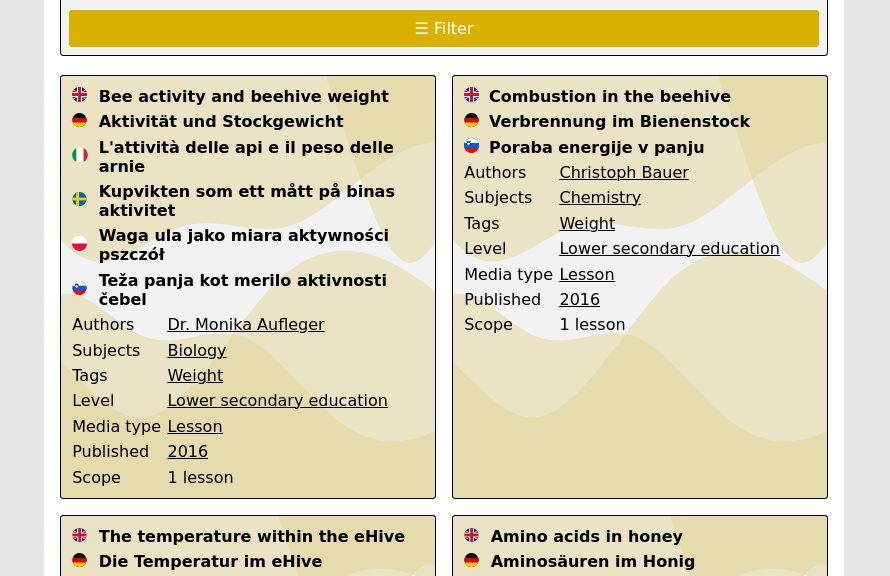
As can be seen in the screenshot above, all materials are now displayed by default in grouping of all available languages. This makes it easy to see whether a suitable translation is available. In addition to the title, further information such as author, subject or tags are listed directly, enabling a quick overview without requiring the explicit opening of individual files. By clicking on property values marked with a black underline, a filter is activated that only displays materials with the same value. Clicking on the colored module card of each material takes you to the detailed view including a brief description and the links to download.
Related materials / Suggestions
In the detailed view, related materials from our database are automatically listed at the bottom of the screen. If the selected lesson suggestion does not quite meet your needs, it is worth taking a look at this listing. Although the suggestions are generated in different categories (author, subject, tags), we have made sure that there are no annoying duplications in the suggestions.
Login system
Access to the teaching staff area is restricted by a login (as in the old system). However, a user session is now valid on the entire BeeBIT homepage (with the exception of the diagram viewer). While the site does not yet effectively take advantage of such an overarching system, future scenarios are conceivable that could require a login to unlock supplemental materials in other areas of the site as well. Teachers who do not yet have an account can easily register. Please note that the login data could not be transferred from the old system. For a short transition period, both systems will be operated in parallel. Nevertheless, we ask all those affected to register for the new system. A renewed check of your access authorization will not be necessary.
A peek into available materials
Representative of the large number of teaching units in our database, three examples will be presented to give a rough overview of the scope, orientation and content of the materials.
Forest or flower honey
The first lesson stems from a physical-chemical area. The students receive an introduction to the methodology for measuring the electrical conductivity of a liquid. The conductivity can be used to distinguish between different types of honey. Quote from the introductory section of the worksheet:
Electrical conductivity is considered to be one of the best parameters for analysing and authenticating honey, and differentiating between honey made from nectar (“blossom” or “flower honey”) and honey made from honeydew (“forest honey”). It is the origin that determines the composition of the honey – and hence its electrical conductivity. According to the guidelines of the International Honey Commission (IHC), the electrical conductivity of honey is defined as that of a 20 % weight in volume (w/v) solution in distilled water at 20 °C, where the 20% refers to honey dry matter (dry matter basis). The result is expressed in microSiemens per centimetre (µS/cm). Honeys with an electrical conductivity of more than 800 µS/cm are labelled honeydew or forest honeys. The electrical conductivity values of mixtures of forest and flower honeys range between 600 and 800 µS/cm. Pure flower honeys show electrical conductivity values between 350 and 600 µS/cm. If the electric conductivity value is below 250 µS/cm, this might indicate that the bees have been artificially fed with sugar and such honey is banned by Departments of Health and Food Safety in many countries.
If the water content of the honey to be tested is known (see related experiment Water in honey), the dry mass required for the experiment can be weighed out. Only with precise weighing one receives a comparable value of the electrical conductivity after dissolving the honey in distilled (!) water. By measuring different types of honey, the students should validate the values claimed in the introductory text. How can an unacceptable dilution of the honey be excluded using the learned method? Is there a correlation between colour and electrical conductivity of the honey?
Bee larvae
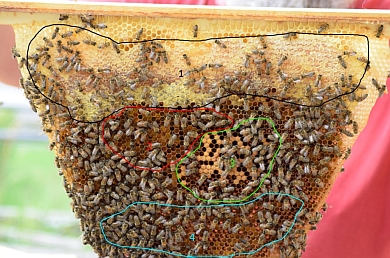
In this strongly biologically influenced lesson, the students should first learn about the spatial organization of a honeycomb using the photo below and an explanatory text. Then, the temperature inside a beehive is investigated. Based on the measurement data of the eHives, students should compare the inside and outside temperature. What is noticeable at the time of brood? Can the position of the brood combs be determined from the temperature curves? The author gives the following hint:
The bees have to maintain a constant temperature of 35°C in the hive, so that the larvae can develop into adults.
(Note: For a more in-depth analysis of the eHive data, we refer to posts in this blog. For example, an analysis using the Python3 programming language is presented in detail in the posts of 07/20/2019 and 09/22/2019).
The bee database (part 1/3)
The topic of databases in the subject of computer science is, from experience, a rather dry undertaking for many students. The author of the last material presented here has designed three practical lessons, the first of which is presented as an example.
The data collected by the eHives is stored in an SQL database and can also be displayed via the diagram viewer using SQL queries. Starting from real measured data, basic elements of the syntax are introduced and learned in small practical questions. From the table of the outdoor temperature sensor, for example, the highest and lowest temperature ever measured in the observation period can be queried quite easily.
Parts 2 and 3 of the teaching module deal with increasingly complex questions but at the same time allow the investigation of more interesting correlations. For example, can a correlation be derived between weather and the development of stick weight? What SQL queries can be asked to help answer the question?
(cw) 2021-10-03
 DE
DE